Alertness Calculator
Calculate your current alertness level and map your personal alertness curve throughout the day — based on sleep, time, and circadian biology.
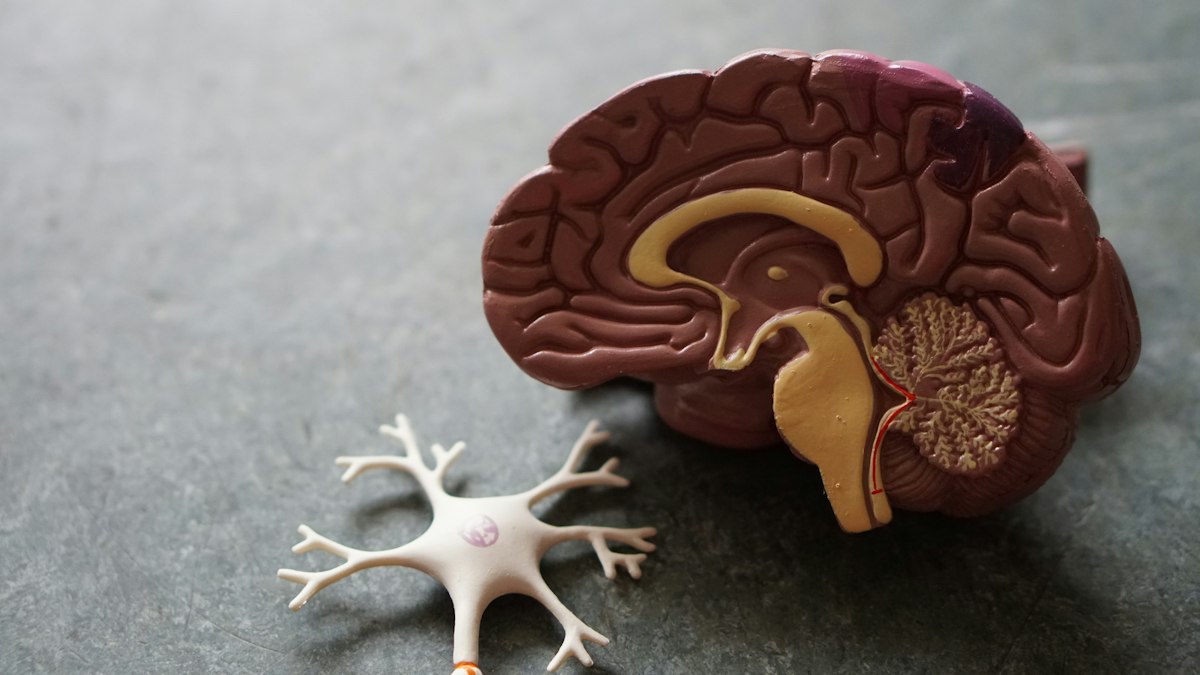
Brain scan and alert person representing alertness prediction and optimization · Photo: Unsplash
How Alertness Works — The Two-Process Model
Alertness at any moment is the result of two competing biological processes. Process S (sleep pressure / homeostatic drive) builds continuously during waking hours — the longer you've been awake, the sleepier you become. Process C (circadian drive) follows a roughly 24-hour wave, peaking in alertness in the late morning and again in early evening, with a trough in the early afternoon and a steep fall in the late evening.
The alertness dip at 1–3 PM is real and biological — not caused by lunch. It reflects the circadian trough in cortisol and core body temperature. This is why napping (and siesta cultures) align with this window — the body is biologically prepared for sleep. Knowing your personal alertness curve lets you schedule demanding cognitive work during peaks and routine tasks during troughs.
Sleep Debt's Effect on Alertness
Sleep debt elevates Process S continuously — meaning higher background sleepiness at all times of day. A person with 10 hours of accumulated sleep debt experiences the 1–3 PM trough at a much lower alertness baseline, often producing involuntary microsleeps (1–5 second sleep episodes) that impair task performance significantly. The circadian peaks are also lower, meaning their "best" window is substantially diminished.
The Two-Process Model of Alertness
Your current alertness level is determined by two interacting processes that sleep scientist Alexander Borbely formalized as the Two-Process Model of Sleep. Process S (homeostatic sleep pressure) is adenosine accumulation since you last woke -- it rises during wakefulness and falls during sleep. Process C (circadian rhythm) is the biological clock's 24-hour alerting/sleeping signal -- it produces predictable peaks and troughs throughout the day regardless of how much sleep you've had.
When these two processes interact, they explain why you feel alert at 10 AM even after a poor night (circadian alerting is high), why you feel sleepy after lunch even when well-rested (circadian trough at 1-3 PM), and why severe sleep deprivation eventually overcomes the circadian alerting signal entirely. Our alertness calculator models both components using your sleep history and current time to predict your alertness level and forecast its trajectory across the coming hours.
Optimizing Alertness for Important Tasks
Knowing your alertness forecast allows strategic scheduling. Schedule cognitively demanding work (analysis, writing, learning, decision-making) during your predicted alertness peaks. Schedule routine or less demanding tasks during the 1-3 PM trough. Use caffeine strategically -- targeted to 30-45 minutes before needed alertness peaks rather than constantly throughout the day -- to get maximum benefit with minimum sleep disruption. Use our Caffeine Calculator and this alertness calculator together for complete alertness management.
Using Alertness Forecasts for Planning
Your alertness forecast is most useful as a weekly planning tool. Once you know your typical peak (usually 2-4 hours after waking) and trough (1-3 PM circadian dip), you can design your daily schedule around these natural rhythms rather than fighting them. High-complexity, creative, or novel tasks belong in the peak window. Administrative tasks, meetings, and routine work fit better in the trough window when possible. Physical activity can be placed in the secondary afternoon alertness window (late afternoon) that many people experience after the post-lunch trough.
Sleep deprivation "flattens" the alertness curve -- the peaks become lower and the troughs become longer and deeper. This makes strategic scheduling less effective because there is no meaningful peak to protect. This is another cost of chronic sleep restriction that is rarely quantified: you lose not just average alertness but the differential performance across your most valuable cognitive peak periods.